
A multiplication chart hangs on the classroom wall. Sits inside a binder. Lives on the fridge. But just having one around doesn’t teach anything. A chart is a tool. Like any tool, it works well only when someone knows how to use it properly.
Plenty of parents and teachers print out multiplication charts and hope for the best. The kid looks up an answer. Move on. Forgets it five minutes later. That’s not learning. That’s just copying.
The good news? A few small changes turn that chart from a crutch into a real teaching machine. This guide breaks down exactly how to use a multiplication chart the right way. No fluff. No complicated theories. Just steps that work.
First Things First: Pick the Right Chart
Not every chart works for every kid. Using the wrong range sets everyone up for frustration.
For beginners: A 1-10 chart keeps things manageable. Fewer boxes. Less overwhelm. The basic pattern becomes clear without too much noise.
For most kids (Grades 3-4): The 1-12 chart is the standard. Covers everything tested in school. Matches what teachers use.
For advanced learners: A 1-15 or 1-20 chart pushes further. Good for pre-algebra prep or kids who already know their basic facts.
Using a 1-20 chart with a child who hasn’t mastered 1-12 yet? That’s a recipe for frustration. Master the smaller range first. Then expand.
Colour charts help visual learners track rows and columns. Black and white charts work fine for older kids or classroom printing. Blank charts are for practice. Filled charts are for reference. Keep both versions around.
How to Read the Chart Correctly
Sounds simple. But a surprising number of people use multiplication charts the wrong way. They guess. They jump around. They get lost between rows and columns.
Here’s the correct method:
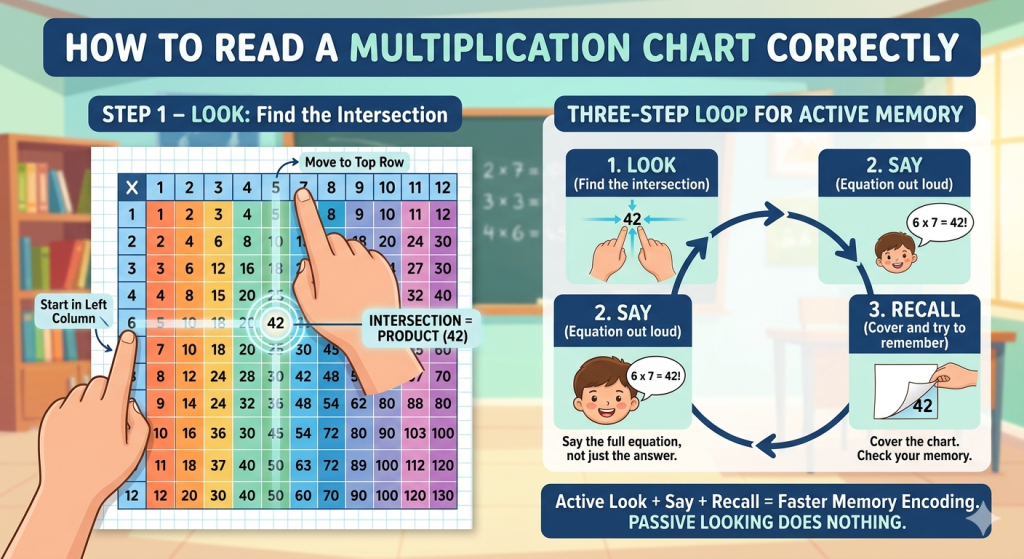
Find the first number in the left column. That’s the row. Find the second number in the top row. That’s the column. Run a finger across from the first number. Run another finger down from the second number. The box where both fingers meet holds the answer.
That takes less than a minute to learn. But knowing how to read the chart is only half the battle. The real skill is using it to build memory, not just find answers.
Methods:
Looking up an answer and moving on does almost nothing for memory. The brain treats it like a quick search. In one ear. Out the other.
Here’s a three-step loop that changes that:
Step 1 : Look: Find the answer on the chart using the method above.
Step 2 : Say: Say the full equation out loud. “Six times seven equals forty-two.” Not just the answer. The whole thing.
Step 3 : Recall: Cover the chart. Say the equation again from memory. Then check to see if it was right.
That loop takes about ten seconds. But those ten seconds activate memory encoding instead of passive looking. Do this every time a fact gets looked up. Within a couple of weeks, the “look” step starts feeling unnecessary. That’s the goal.
Filled Charts vs. Blank Charts: Two Different Jobs
A filled chart and a blank chart are not the same thing. They serve completely different purposes.
Use a filled chart when:
- The child is first learning new facts
- Homework needs a reference tool
- Passive exposure is the goal (hung on a wall or inside a binder)
Use a blank chart when:
- Testing recall of already-studied facts
- Identifying weak spots (the boxes left empty show exactly what needs work)
- Daily or weekly practice checks
Starting with a filled chart makes sense. Let the child look things up freely for a week or two. No pressure. Then switch to the blank version. The blank chart reveals gaps immediately. A child might think they know 7×8 until they try to write it in an empty box without looking. That honest feedback is where real progress happens.
Cover and Check: A Five-Minute Daily Drill
Here’s a simple routine that takes almost no time but delivers results.
Take a blank chart. Set a timer for five minutes. Fill in as many boxes as possible from memory. When the timer goes off, grab the filled chart. Check every answer. Circle the wrong ones or the empty ones. Those circled facts become tomorrow’s focus.
Do this every day. Not for an hour. Just five minutes. Consistency beats intensity every time. Most kids show noticeable improvement after two weeks of this routine. No stress. No long study sessions. Just a few minutes of honest recall.
Pattern Spotting: The Secret Most People Miss
Using a chart only as an answer key misses the real value. The best way to use a multiplication chart is as a pattern-spotting tool.
Here are patterns worth looking for:
Multiples of 2: Shade them in. Every single one is even. No exceptions.
Multiples of 5: Look down the column or across the row. Every product ends in 0 or 5.
Multiples of 10: Every product ends in 0. Easy to spot. Easy to remember.
Perfect squares: Look at the diagonal from top-left to bottom-right. 1, 4, 9, 16, 25, 36, 49, 64, 81, 100, 121, 144. Those are all the products where a number multiplies by itself.
The symmetry trick: The box at row 3, column 4 (3×4) equals the box at row 4, column 3 (4×3). The whole chart mirrors itself across that diagonal. That cuts the number of facts to memorize in half.
When a child sees these patterns, memorization becomes easier. The brain doesn’t have to remember 100 isolated facts. It remembers a few rules and patterns. The chart becomes a discovery tool instead of a crutch.
How to Avoid Chart Dependency
A real concern among parents and teachers is that the chart becomes a crutch. The child looks up every fact and never memorizes anything. That happens when the chart is used only as an answer key.
Here are rules that prevent dependency:
For homework: The child attempts the answer first. Only after trying does the chart get checked. No looking up before attempting.
For timed practice: Use a blank chart. No filled chart allowed during the timed portion. Check answers afterward.
For daily review: Keep the chart visible. But the child must say the answer out loud before looking. Not after. Before.
The chart is a bridge, not a destination. Use it to get from “don’t know” to “know.” Over time, the chart gets used less and less. Eventually, it becomes a backup rather than a necessity.
Using the Chart for Skip Counting
Skip counting is the foundation of multiplication. A chart makes skip counting visual in a way that just saying numbers out loud does not.
Pick a number. Say 3. Start at 0. Count by 3s while following along on the chart. 3, 6, 9, 12, 15, 18, 21, 24, 27, 30, 33, 36. The finger moves down the column. The pattern becomes obvious.
Do this for different numbers. Notice how the 2s column hits every other number. How the 5s column bounces between 0 and 5 endings. How the 9s column has a digit sum of 9 (9, 18, 27, 36, add the digits, get 9 every time until 90).
Skip counting races work well. Call out a number. See how fast the finger can move down that column while saying the multiples out loud. Turns a boring drill into something more like a game.
Common Mistakes and Fixes
Mistake : Looking up the same fact over and over without recalling. Fix it by adding the “Say” and “Recall” steps every single time.
Mistake : Using a filled chart when a blank chart would work better. Fix it by switching to the blank version once basic familiarity exists.
Mistake : Letting the child write on the chart without saying the equation. Fix it by requiring the full equation out loud before writing anything down.
Mistake : Moving to a larger range before mastering the current one. Fix it by staying with the current range until the blank chart gets filled completely with no errors three days in a row.
Conclusion
A multiplication chart is not magic. It’s a tool. Used the wrong way, it becomes a crutch that prevents real learning. Used the right way, it becomes one of the most effective teaching tools available.
Pick the right range for the child’s skill level. Use the Look, Say, Recall loop instead of passive looking. Switch between filled charts for reference and blank charts for practice. Spend five minutes a day on cover-and-check drills. Spot patterns instead of just finding answers. Set rules that prevent dependency.
That’s it. No expensive apps. No complicated systems. Just a simple chart and a smart routine. Give it a few weeks of consistent use. The results will speak for themselves.